
The Excess Deaths Project
On February 24th, the Australian Bureau of Statistics (ABS) updated its provisional excess death statistic for 2022 from 16% to 15.1%. If you have come to this website after seeing a graph or flyer giving a figure of 16% excess deaths in 2022, that was from the previous ABS release made on 22nd December 2022.
This is what the February release says:
“In 2022, there were 174,717 deaths that occurred by 30 November and were registered by 31 January 2023, which is 22,886 (15.1%) more than the historical average.”
Is it unusual to have 15.1% more deaths than average?
Here’s a graph showing the excess rate of deaths (more than the average of the past five years) from 1955 to 2021. (Detailed information about the graph can be found in notes at the end of this article).
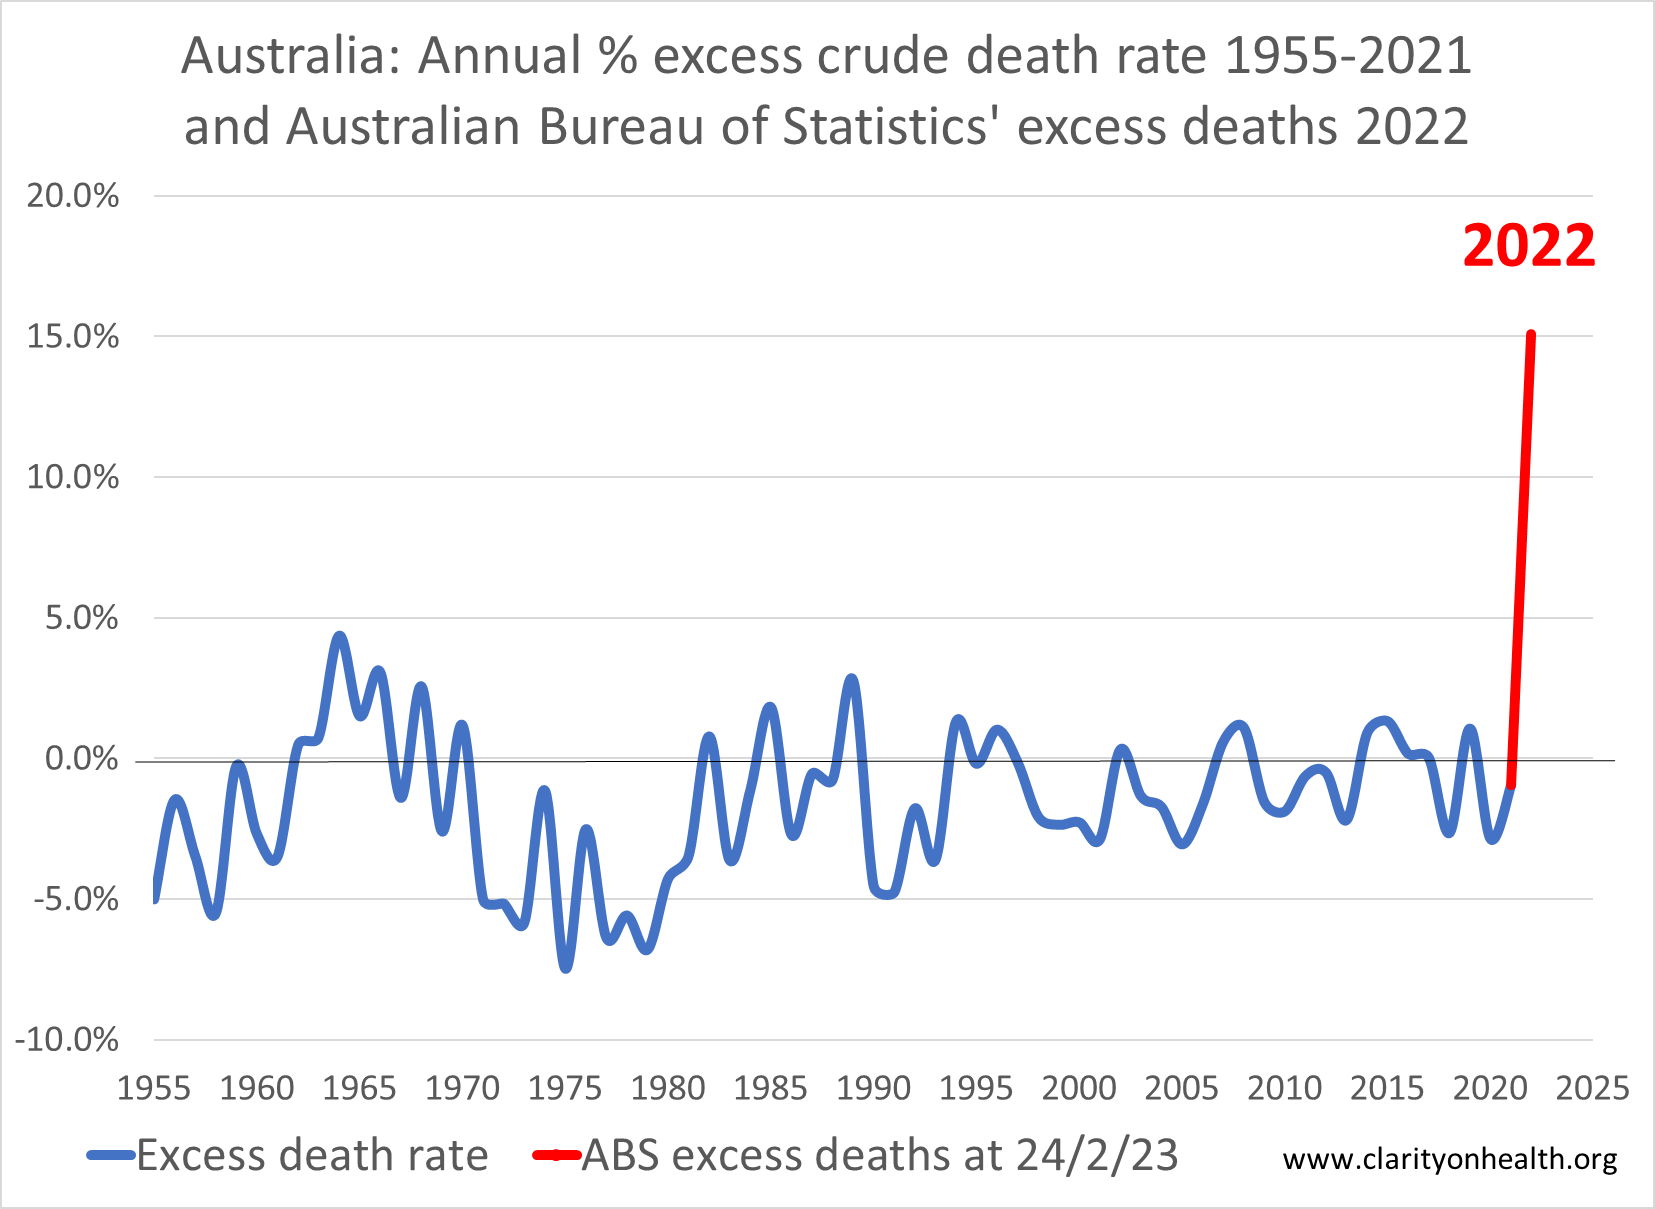
Before the highly anomalous year of 2022, the highest annual increase in deaths per population was 4.4%, which occurred in 1964. On average, over the 66 year period, there was an annual 1.6% decrease in the death rate.
With a toll of 22,886 more Australians than expected dying in the 11 months up to November 2022, we owe it to them and to their families to ask questions.
Perhaps these extra deaths have been due to covid, I hear you suggest?
Well, by 30th November 2022, according to the ABS, 9,115 of the deaths were recorded as being due to covid. So, taking these figures at face value, that means only 6.0% of the 15.1% excess deaths were due to the virus. In other words three fifths of the excess deaths were caused by something else.
Of course, we must scrutinise the cause of these 9,115 covid deaths. Remembering the, perhaps overly bold, claim that the covid injections would protect us from severe illness and death. Surely, it is remiss of the ABS not to report how many of the people who died ‘due to covid’ had received the injections?
If thousands of ‘fully-vaccinated’ Australians died from covid in 2022, we need to be told. Those whom we have given our trust to, until now, do not have the right to require us to trust that the vaccines are working. After all we have been put through, we need real-world evidence.
In addition, what is clear from the ABS data is that, over and above the deaths from covid, a lot more Australians died in 2022 than usual. A total of 13,771 non-covid deaths by the end of November.
That’s the equivalent of an Australian Airbus 330-300 crashing every week (297 passengers plus staff).*
And the total excess deaths of 22,886 equates to a crash every four to five days.
Why did these people die? This question needs to be answered urgently.

The excess death rate equates to a 300-seat passenger airliner crashing every four days.
If the cause was plane crashes, none of us would be catching a flight.
But the cause(s) have not yet been examined. Few people are even aware that there are so many more deaths than usual. This means we are living (and sadly, some of us are dying) as if blindfolded, simply accepting that it’s OK not to know.
It’s not OK!
In 2020, any death from Covid was headline news.
In that entire year, 906 people were reported as dying of the disease. But now our latest statistical information suggests that more than that number of Australians may be dying every three weeks, without proper explanation.
Where is the headline news on that?
The ABS made a further release of provisional mortality statistics for 2022 on March 31st 2023. This reported 25,235 (15.3%) deaths more than the historical average including deaths to December 31st 2022 that were registered by 28th February 2023.
That’s another 2,349 Australian unexplained extra deaths. What is going on?
Australians deserve answers.
Notes for graph:
The blue line up to 2021 shows the percentage excess death rate compared with the average death rate over the preceding five years.
The data for the blue line has been calculated from data on deaths from Our World in Data (ourworldindata.org) and data on population (also from ourworldindata.org) covering the years 1950-2021.
The death rate used for the blue line is the change in the ‘crude mortality rate’. This is the number of deaths in the year divided by the population in that year. (Using a death rate per thousand of the population helps allow for increases or decreases in the number of deaths which are simply due to changes in the size of the population.)
For 2022, the data point in red is a provisional figure of 15.1% excess deaths released by the Australian Bureau of Statistics (ABS) on 24th February 2023. Note, this figure compares number of deaths recorded so far in 2022 with the number of deaths averaged over four years (2017, 2018, 2019 and 2021). The ABS says: “2020 is not included in the baseline for 2022 data because it included periods where numbers of deaths were significantly lower than expected.” It follows that, if 2020 had been included in the baseline comparator (which normally comprises the average of the past five years), the percentage of excess deaths would have been higher.
Note that the ABS provisional figure for 2022 is 15.1% excess deaths, not a 15.1% excess crude mortality rate. Hence the red part of the graph will include some extra deaths that are simply due to an increase in population. Based on a population figure for June 30th 2022 released by the ABS, we estimate that the excess crude mortality rate in 2022 will be 12.2%, which remains a figure unprecedented in the past 66 years.
Data sources:
https://www.abs.gov.au/statistics/health/causes-death/provisional-mortality-statistics/jan-nov-2022
https://www.abs.gov.au/statistics/health/causes-death/provisional-mortality-statistics/jan-sep-2022
https://www.abs.gov.au/articles/covid-19-mortality-australia-deaths-registered-until-31-january-2023
https://ourworldindata.org/grapher/births-and-deaths-projected-to-2100?country=~AUS
https://ourworldindata.org/grapher/un-population-projection-medium-variant?country=~AUS
https://www.abs.gov.au/statistics/people/population/national-state-and-territory-population/jun-2022
*Thank you to Dr Ah Kahn Syed of Arkmedic’s blog for the idea of making the numbers meaningful by thinking in terms of plane crashes