How accurate is the official temperature history for your city or town?
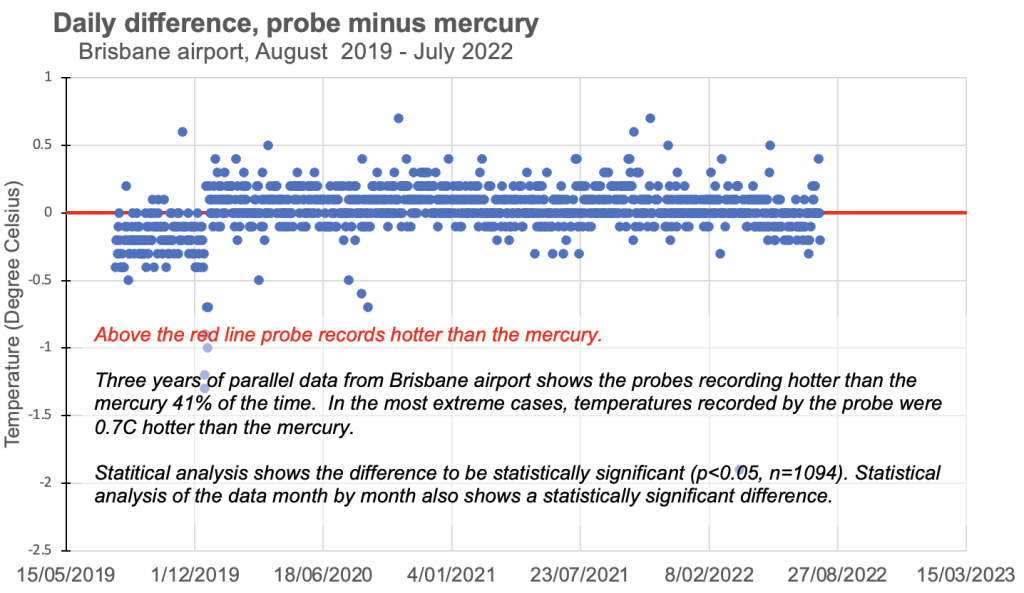
Statistical analysis of 3 years of maximum temperature data for Brisbane airport shows the temperatures recorded from the probe in an automatic weather station are significantly different from the mercury thermometer. This contradicts claims by the Bureau’s Director, Andrew Johnson, that measurements from these two instruments are equivalent. The probe has been the official measuring instrument since November 1996 with these temperature values incorporated into national and international databases used to calculate climate trends. In the most extreme cases, temperatures recorded by the probe were 0.7 degrees Celsius hotter than the mercury. Analysis across the three-year period, shows the probes record higher 41 per cent of the time, the same 32 per cent of the time, and lower 25 per cent of the time.
The editorial in The Weekend Australian explains:
Given the high level of public interest in record temperatures as well as the significant financial stakes involved, the Bureau of Meteorology has a duty to be transparent about how it collects and handles its data. The belated release of data that compares temperatures recorded by traditional mercury thermometers and new resistance probes that sit alongside each other at Brisbane Airport is a welcome start.
But it has raised as many questions as it has answered. The bureau continues to insist there is no significant difference and that its recording devices are maintained to the highest standard. But analysis of the data shows, across the three-year period for which records have been made available, probes returned temperatures higher than the mercury thermometers placed alongside them for 41 per cent of the time.
Recordings were the same for 32 per cent of the time and lower for 25 per cent of the time. In the most extreme cases, temperatures recorded by the probes were 0.7C hotter than the mercury.
This raises some difficult questions about the bureau’s ability to claim new records are being broken at stations when comparing temperatures taken with the new technology with temperatures recorded using mercury thermometers in the past. Given that new records are claimed on the basis of readings that are only a tiny fraction of a degree warmer, the problem is obvious.
The bureau continues to back its technology, as it is entitled to do. But, given the results of analysis of what has been made public, it is difficult to argue all of the parallel data records the bureau holds should not be made available for similar inspection.
The lengths to which the bureau has gone not to co-operate with Freedom of Information requests for data gives the impression of an organisation with something to hide.
As we report on Saturday, more than three years after a FOI request was lodged by scientist John Abbot, the bureau released three years of data after its refusal was challenged in the Administrative Appeals Tribunal. Throughout the ordeal, the bureau had first claimed there was no parallel data as it simultaneously erected barriers to the public accessing parallel temperature data by saying there would be high processing costs involved. The bureau refused to waive the costs of satisfying the initial FOI request, claiming there was no public interest in the data sought.
The applicant correctly argued it was truly astonishing that the bureau would argue that accurately evaluating the extent of temperature change during the past 100 years by fully understanding the effect of changes in instrumentation was of no public interest. This is particularly so given the bureau was simultaneously publishing reports and giving media interviews claiming that a temperature increase of 1.5C would have devastating consequences for the planet.
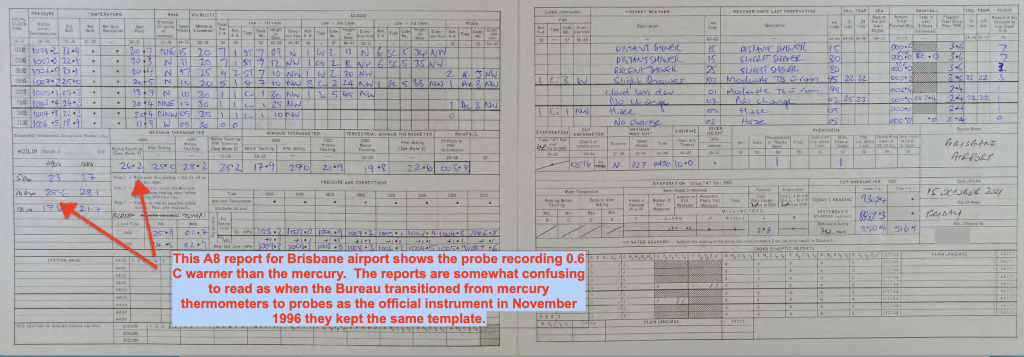
The documents finally released by the bureau included 1094 A8 reports with the handwritten daily maximum and minimum temperatures from both probes and traditional liquid-in-glass thermometers recorded from instruments in the same shelter or Stevenson screen. They represent only 20 per cent of the parallel records held for the Brisbane Airport site, which is one of 38 sites that were originally requested under FOI. The bureau is believed to hold 760 years worth of parallel data from 38 locations spread across Australia.
The information it contains is of more than academic interest, given that much of it eventually finds its way into what becomes the international record for global temperatures on which climate change policy is made. Dr Abbot, the scientist who made the initial FOI application, says he will persevere with new requests to get the remaining information. He says the information should be made freely available as it was clearly in the public interest.
We agree. The Bureau of Meteorology is a public institution and the information it holds is the property of the public. Parallel data records should be made immediately available alongside all of the other data the bureau prides itself on making public.
There should also be a proper, expert appraisal of what the information says, whether it has been collected as fully as it should have been, and whether the bureau is indeed following world’s best practice in the use of platinum resistance probes, as it says it is, despite World Meteorological Organisation advice to the contrary.
SOME HISTORY
The Thursday before Easter (April 6, 2023), the Australian Bureau of Meteorology provided John Abbot with the most recent three years of parallel data for Brisbane airport as 1,094 A8 reports with the handwritten daily maximum and minimum temperatures from both probes and traditional liquid-in-glass thermometers recorded from instruments in the same shelter/Stevenson screen.
I began transcribing this data the next day, and then undertook a preliminary analysis of the data.
As far as I know, this represents the first time anyone has been successful at obtaining parallel temperature data from a freedom of information request in Australia, and perhaps for anywhere in the world.
John Abbot first requested the parallel data for Brisbane airport on 12 December 2019. Dr Abbot initially requested all the available data sets of daily maximum and minimum temperatures, which the Bureau confirmed existed as parallel data for Brisbane airport back to January 2008. While confirming the existence of this data, the Bureau asked that the scope of the request be reduced in size, specifically that the request be limited to a three-month period or 3 x 1-month periods. The case eventually went before the Administrative Appeals Tribunal on 3 February 2023, and was subsequently resolved with the Bureau agreeing to provide three years of data, specifically the 3 most recent years (August 2019 to July 2022) of parallel data for Brisbane airport – that was received the Thursday before Easter.
These three (3) years of data represents just 3 of the 14.5 years (January 2008 to July 2022) of parallel data that the Bureau holds for Brisbane airport. These three years of data, represents just a fraction of the 760 years of parallel data that I estimate the Bureau holds for a total of 38 different locations spread across the landmass of Australia.
Bill Johnston was unsuccessful in his request for data from Canberra airport in 2014, and this was erroneously reported as all this data having been destroyed.
I successfully secured limited parallel data for Mildura in October 2017 and again in December 2017 following the intervention of then Minister for the Environment Josh Frydenberg.

HOW TEMPERATURES ARE RECORDED
The maximum daily temperature is measured as the hottest temperature in a 24-hour period. This was traditionally recorded using mercury thermometers; as the air temperature rose mercury was forced up the tube and as the temperature fell the constriction prevented the mercury from returning to the bulb. The height of mercury, traditionally read manually at 9am, showed the hottest temperature for the previous day and was reset by gentle shaking.
Thirty years ago, probes in automatic weather stations (AWS) began replacing mercury thermometers for the measuring of maximum temperatures across Australia and the world. These probes are generally more sensitive to changes in temperature — so they can measure extremes of temperatures that traditional mercury thermometers with slower response times cannot detect.
Most meteorological offices attempted to achieve equivalence between the probes and mercury by averaging instantaneous recordings from probes over 1 to 5 minutes. The Australian Bureau of Meteorology adopted a different policy instead taking instantaneous readings every one-second from custom-designed probes with longer time constants purported to mimicked mercury thermometers.
Equivalence is important for the construction of reliable historical temperature datasets, for understanding temperature trends and for knowing if a new record hot day as measured automatically by a probe really is hotter than what might have been read manually from a mercury thermometer.
ANALYSIS OF THE DAILY MAXIMUM TEMPERATURE DATA
Subtracting the daily temperature as recorded by the mercury thermometer from the daily temperature as recorded by the probe provides some indication of equivalence. Chart 1 is a scatterplot of this difference, and it shows that for the three (3) years from 31st July 2019 through until 30 July 2022, the probe twice recorded 0.7 degrees Celsius warmer than the mercury for the same weather. The probe often recorded 0.3 and 0.4 degrees Celsius warmer.
This has implications for the recording of new record hot days, as a mercury thermometer may have recorded 0.7 degrees cooler.
Considering the daily values as a time series there appears to be a discontinuity at the end of 2020.
MAXIMUM TEMPERATURE DATA AS MONTHLY MEANS
The daily values can be averaged as a monthly mean. When these monthly means are plotted as a time series the dramatic change in the relationship between temperatures as recorded by the mercury and the probe becomes more obvious, Chart 2.
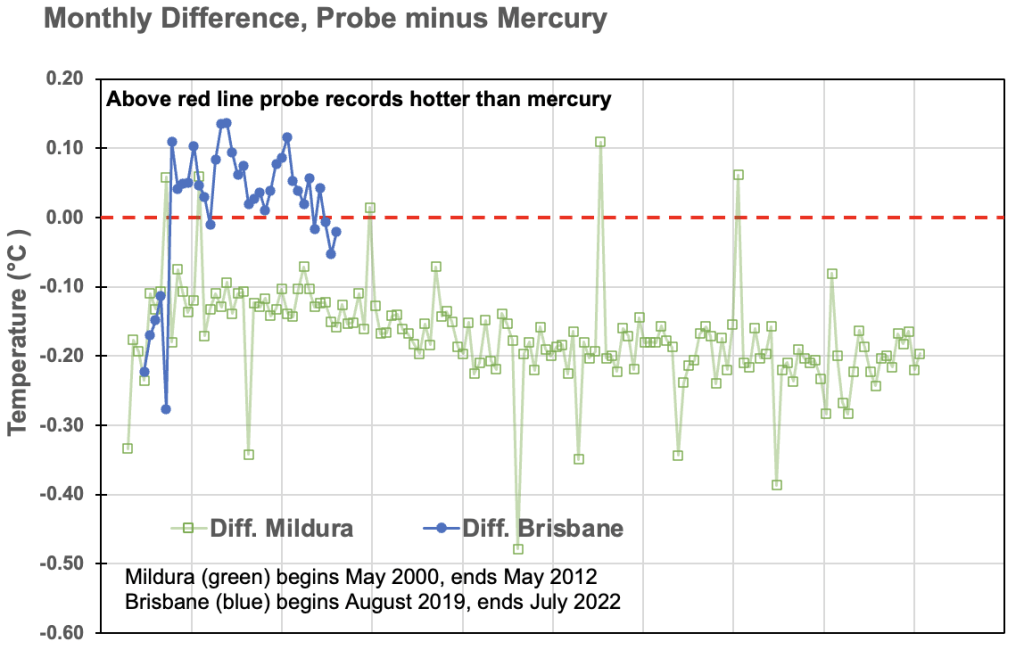
Before January 2020 the mercury was recording on average warmer than the probe, from January 2020 the probe was on average recording warmer.
Most monthly maximum temperatures from January 2020 fall above the red dashed line, indicating that after this time the probe recorded warmer than the mercury.
I initially thought that this step-change from minus 0.28 in December 2019 to plus 0.11 in January 2020 (a difference of 0.39 °C) represented recalibration of the probe at the beginning of 2020.
The Bureau has denied this, claiming it represents a fault with the automatic weather station in December 2019, that was fixed.
Considering the maximum temperatures as monthly averages, the difference shows the probe initially recording on average nearly 0.2 degrees Celsius cooler than the mercury, and then after what appears to be a recalibration of the probe at the beginning of January 2020, the probe records on average 0.15 degrees warmer than the mercury through until the end of the record.
The step-up cannot be credibly explained by way of a one-off fault.
The difference between the two periods represents an average difference of 0.35 degrees Celsius over the three years of the available record.
The monthly mean maximum temperature falls below the red dashed line from May 2022 suggesting the probe is drifting and may need recalibration.
A similar pattern in the temperature difference between the probe minus the mercury was evident in the parallel data that I obtained for Mildura, as shown by the green series in Chart 2.
There is an article about this in The Weekend Australian, entitled Measure of Contention in Bureau of Meteorology Probe Row.
REQUESTS FOR PARALLEL DATA
I first asked for access to the parallel measurements for Wilsons Promontory lighthouse on 25th August 2015. This request was ignored.
On 16th October 2017, John Abbot first made a formal Freedom of Information request for the parallel data for not only Wilsons Promontory, but also the desert location of Giles where there should be parallel data for the last 25 years.
These requests were refused.
On 12 December 2019, John Abbot made a further request for parallel data from Brisbane airport.
BUREAU NOT CONSISTENT WITH OWN POLICIES
The Australian Bureau has a policy of maintaining mercury thermometers with probes in the same Stevenson Screen for a period of at least three years when there is a change over. This policy, however, is not implemented and mostly ignored. For example, the Rutherglen agricultural research station had a long, continuous, temperature record with minimum and maximum temperatures first recorded using standard and calibrated equipment in a Stevenson Screen back at the beginning of November 1912. Considering the first 85 years of summer temperatures – unadjusted/not homogenized – the very hottest summer on record at Rutherglen is the summer of 1938/1939.
At Rutherglen, the first significant equipment change happened on 29 January 1998. That is when the mercury and alcohol thermometers were replaced with a probe – custom built to the Australian Bureau of Meteorology’s own standard, with the specifications yet to be made public. According to Bureau policy, when such a major equipment change occurs there should be at least three years (preferably five) of overlapping/parallel temperature recordings. However, the mercury and alcohol thermometers (used to measure maximum and minimum temperatures, respectively) were removed on the very same day the custom-built probe was placed into the Stevenson screen at Rutherglen, in direct contravention of this policy.
One might think it prudent to have maintained the two methods of measurement alongside each other for some period at Rutherglen to determine whether there were any biases. There are parallel data for just 38 of the 695 locations with new Automatic Weather Stations. That is there is a record of temperatures from both an alcohol in glass thermometer used for manual measurement of minimum temperatures, and a mercury in glass thermometer used for manual measurement of maximum temperatures in the same Stevenson screen as the electronic probe. But the equivalence, or otherwise, of temperatures from these different measuring systems has never been established in a rigorous way by the Australian Bureau of Meteorology. Furthermore, only a fraction of one percent of the reams of manually recorded data appear to have been transcribed by the Bureau. Most of the data only exists in handwritten reports many of which may never be archived unless there is a campaign to secure them.
MILDURA PARALLEL DATA
In the report entitled ‘The Australian Climate Observations Reference Network – Surface Air Temperature (ACORN-SAT) Version 2’ published in October 2018, Blair Trewin provides differences in what he refers to as diurnal range between manual and automatic instruments at six sites and concludes these are small. For example, at Mildura, Dr Trewin concludes there is a difference in the maximum temperature of just –0.22°C when considering the data for the period December 1997 to May 2000. What is not explained in this key report is that this is a statistically significant, and it is negative, indicating that the probes were underestimating the extent of warming.
In September 2017, the Bureau claimed a series of new record hot days across south-east Australia, including on 23 September 2017 at Mildura. At that time, the media reported this as a new record for the state of Victoria, specifically claiming it was the hottest September day ever recorded – all the way-back to September 1889.
After the intervention of then Federal Minister for the Environment, Josh Frydenberg, following correspondence from me dated 26th September 2017, I was provided with a first set of parallel measurements for Mildura by way of undigitized photographs of A8 reports with parallel measurements for the period November 1996 to December 2000. I analysed a component of this data after manually transcribing the values and found a statistically significant difference of –0.34 °C, –0.27 °C and –0.28 °C for the month of September for the years 1997, 1998 and 1999, respectively. This is broadly consistent with Blair Trewin’s finding that the probes were recording too cool.
I received a second tranche of photographed A8 reports on 4 December 2017 with A8 reports through until January 2015. Analysis of this data showed that after December 2000, there was a change in both the size of the Stevenson Screen used to house the probes and mercury thermometers at Mildura and then later also a change in the type of probe. The screen was changed on 3rd May 2000, and a different probe installed on 27th June 2012. My analysis of this data suggests that both the change to a smaller screen and the change to a different probe produced discontinuities in the temperature data. In particular, the new probe installed on 27th June 2012 recorded much warmer for the same weather. The probe often recorded 0.4 °C warmer for the same weather.
MORE INFORMATION ABOUT BRISBANE’S TEMPERATURE HISTORY
I have a long-standing interest in the integrity of historical temperature data. I first described the problems attempting an accurate historical reconstruction for Brisbane in a blog post in November 2019.
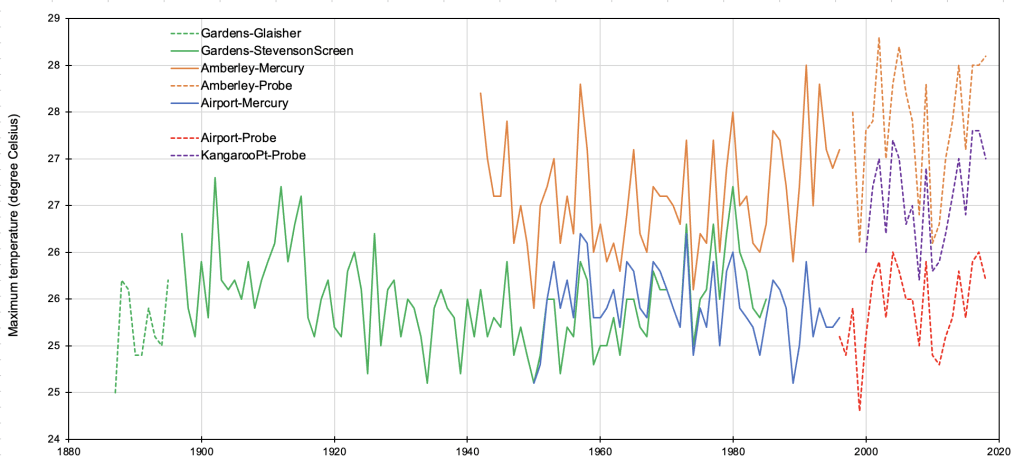
According to the available metadata, maximum temperatures were measured at Brisbane Botanical Gardens (station number 40214) from 1887. For the period 1897 until 1996 temperatures were recorded using the same mercury thermometer in a Stevenson screen. This very long continuous record does not show a pattern of warming. Rather there was warming to about 1900, then cooling to about 1950, followed by warming again.