How to make a placebo look 95% effective and guarantee repeat business
We have provided numerous explanations (see here, and here) and videos (see here and here) explaining why a vaccine that is actually merely a placebo will inevitably appear to have high efficacy if there is a time delay after vaccination during which the participant is classified as ‘unvaccinated’.
Some people have claimed that the examples – using hypothetical data – are unrealistic and that, with different assumptions about the underlying infection rate, the illusion would not happen. Not true.
This example simulates a vaccine roll-out and efficacy evaluation which is essentially how all the 2021 observational studies of the covid vaccines were conducted.
Assumptions:
- The entire population starts week 1 as unvaccinated and by week 14 about 90% of the population has received a single jab (note that we start with a population of one million but the efficacy results are exactly same irrespective of the starting population).
- The vaccination roll-out starts with 1% of the unvaccinated population vaccinated in week 1 and peaks at 35% in week 8 falling back to 10% in each of the last 3 weeks.
- There is a constant weekly infection rate throughout the period (in the example below it is 2% but, as the video shows, the ‘efficacy’ numbers are exactly the same no matter what the fixed rate is).
- Any vaccinated person who becomes infected within the first two weeks of their vaccination is classified as unvaccinated (in fact, as can be seen here, the Office for National Statistics classifies as person infected within the first three weeks of their vaccination as unvaccinated. And also note this is the case in Sweden).
The Excel model can be downloaded from here:
Vaccine Efficacy Simulation 4
52.5KB ∙ XLSX File – Download
86% effective under 14 day rule
Here are the results shown in the video

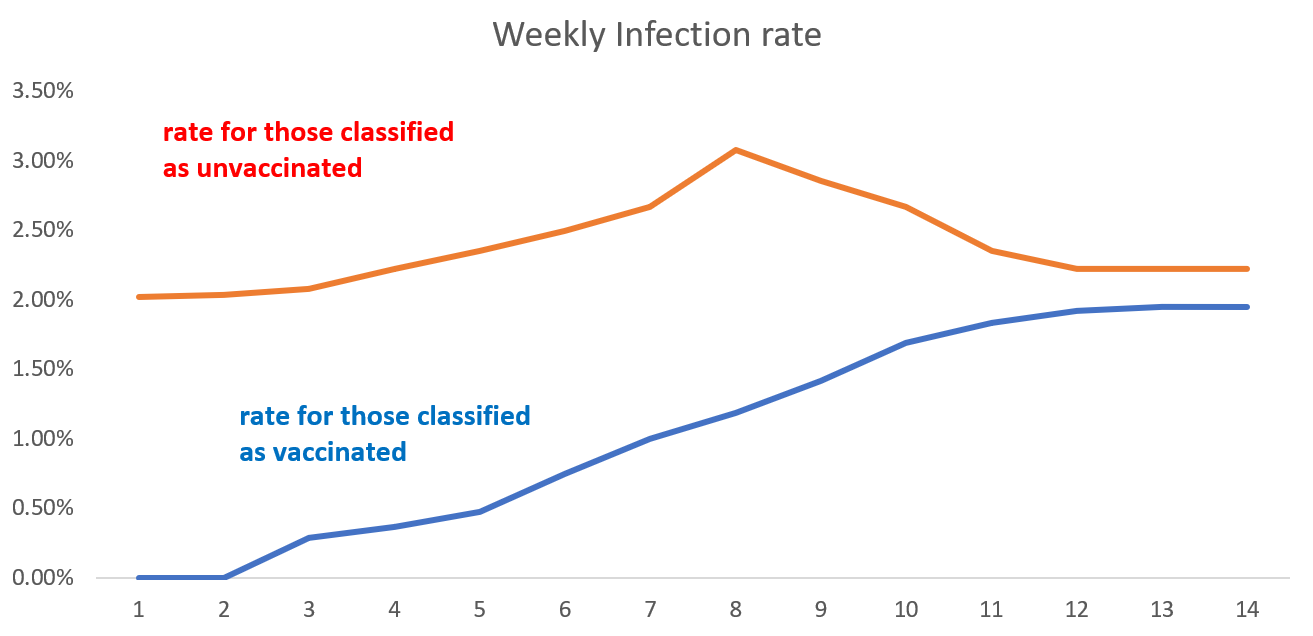
To calculate the infection rate for week n for those classified as vaccinated we divide the cumulative number of people classified as infected and vaccinated by week n by the cumulative number of people classified as vaccinated by end of week n.
For example, by end of week 4 at total of 161,147 people have been classified as vaccinated of whom a total 596 have been classified as infected. So the week 4 infection rate is 596/161,147 which is 0.37%. We do the same for those classified as unvaccinated, so the week 4 infection rate for the unvaccinated is 2.22%. Note that, although the real weekly infection rates of the vaccinated and unvaccinated are always the same 2%, the infection rates after the ‘classification’ are always lower than 2% for those classified as ‘vaccinated’ and higher than 2% for those classified as ‘unvaccinated’:

To calculate the week n efficacy rate we divide the vaccinated infection rate by the unvaccinated infection rate and subtract this from 1, expressing the result a a percentage. Hence, the week 4 efficacy rate is 1 – (0.37/2.22) = 0.834 = 83.4%.

Now we see that a completely useless (with true efficacy 0%) vaccine appears to have very high efficacy in the first few weeks. Although it continually wanes it is still above 50% after week 9. By week 14 the efficacy is still positive but only 12.1% ….. hence the need for a new booster dose! These simulated results are very similar to the real-world efficacy rates that were observed in the first three months of a new vaccine or booster.
Here are the results if there is a three-week, 21 day, period before a person is classified as vaccinated (as per ONS method):

95% effective under 21-day rule
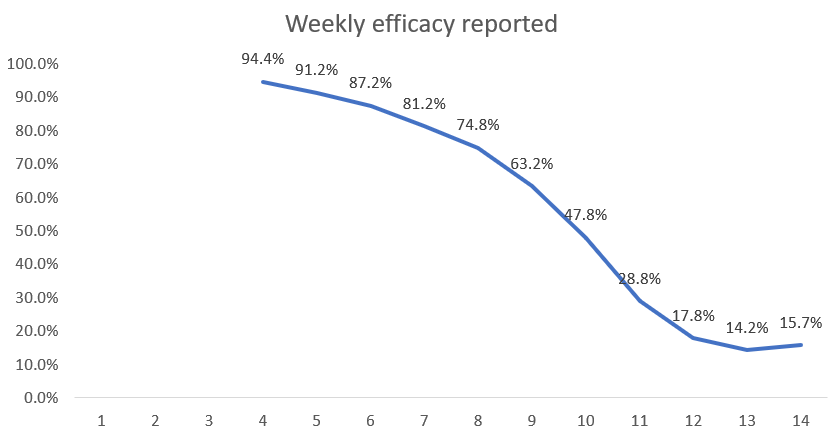
The efficacy achievable under the 3-week period is:

So now they could claim the vaccine starts with 95% efficacy, but again you need the booster after 3 months for vaccination to be truly effective.
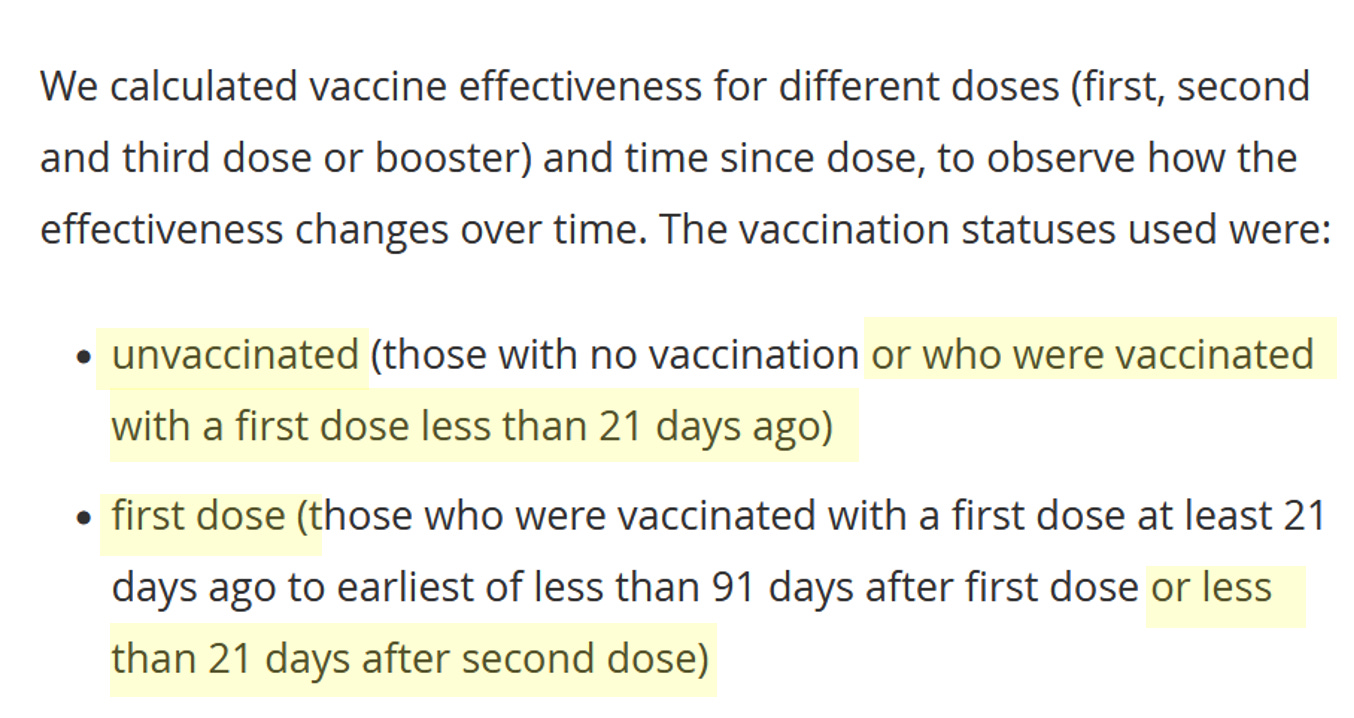
For those who doubt the ONS calculate vaccine efficacy this way here is a screenshot from their document:

The same applies for further doses where there is always a 21 day delay before being classified as having that latest booster shot.
Even negative efficacy can be made to look 95% effective!
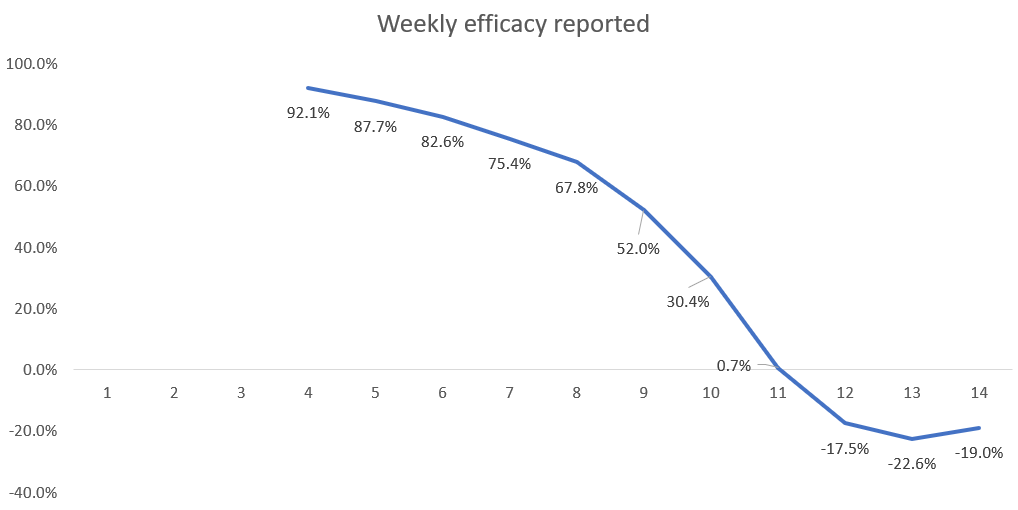
Note that for a placebo vaccine it is impossible to get negative efficacy. However, if there is a slightly higher infection rate for the vaccine compared to no vaccine then, the same assumptions still yield high efficacy initially before eventually becoming negative. Here are the results if the vaccine actually increases the infection rate by 50% (so a 3% infection rate in the vaccinated rather than the assumed 2% in the above simulations):

Caveats
In practice there are a number of factors which, if we included them in the simulation, would produce an even higher efficacy rate than could be claimed for a placebo vaccine. For example:
- The 2021 UK roll out happened during a period when the covid infection rate was declining.
- Asymptomatic unvaccinated people were much more likely to be required to take PCR tests (to go to work or attend events, restaurants etc) than asymptomatic vaccinated people, since the latter only had to show their proof of vaccination. In Israel during this period an unvaccinated person was six times more likely to have to be PCR tested than a vaccinated person. The high false positive rate for asymptomatics would therefore artificially increase the infection rate of the unvaccinated.
- People who were (or had recently been) PCR positive were not allowed to be vaccinated until 14 days after a negative test. This means the vaccinated cohort contained a higher proportion of people who already had natural immunity.
- The so-called ‘healthy vaccinee effect’ whereby it is claimed that the vaccinated are more likely to be more ‘health conscious’ and from a higher socio-economic class meaning that they are less likely to get infected.
As we have shown the illusion of high efficacy is also present if the vaccine is worse than a placebo. In particular we know that, for the covid vaccines, there was a disproportionately high infection rate within the first 14 days after vaccination. Given all of those infected within the first 14 days are classified as unvaccinated, this would lead to even higher efficacy rates than shown in our simulation.
On the isue of immunity, one simplification made in the simulation is that it does not take account of the fact that those who become infected during the period (whether vaccinated or not) would almost certainly not become infected again (and therefore should be removed from the count in subsequent weeks). However, unless the general infection rate is very high this has minimal impact on the efficacy results.
Conclusion
It may be reasonable to allow a certain amount of time for a vaccine to ‘work’. However, classifying a person who becomes infected within 14 or 21 days of vaccination as an ‘unvaccinated case’ in the calculation of vaccine efficacy is nothing short of a scam. It guarantees that any vaccine which is no different (or even worse) than a placebo will be seen to have high initial efficacy.
By using the 21-day period before considering a person vaccinated – as the ONS, and others do, for the covid vaccines – means fraudulently high artificial efficacy rates are guaranteed. The apparent, but completely artificial, ‘waning’ of efficacy can also be used deviously to support the idea that after 3 or 4 months another dose of the vaccine is required to regain protection. Since the same delay in classification is used for those who have received a further dose it is then guaranteed that high efficacy can again be claimed for the subsequent doses.
All of this creates a repeatable business model for Big Pharma.
Whatever efficacy was claimed for the covid vaccines, we have the evidence of our own eyes and ears. While cases of covid in unvaccinated people who were previously infected are rare, it is the vaccinated who are the ones who are subsequently suffering from repeated bouts of covid
Source – https://wherearethenumbers.substack.com/p/the-illusion-of-vaccine-efficacy
