
Explain this.

This is per 100,000 people. In every category, the vaccinated did worse.
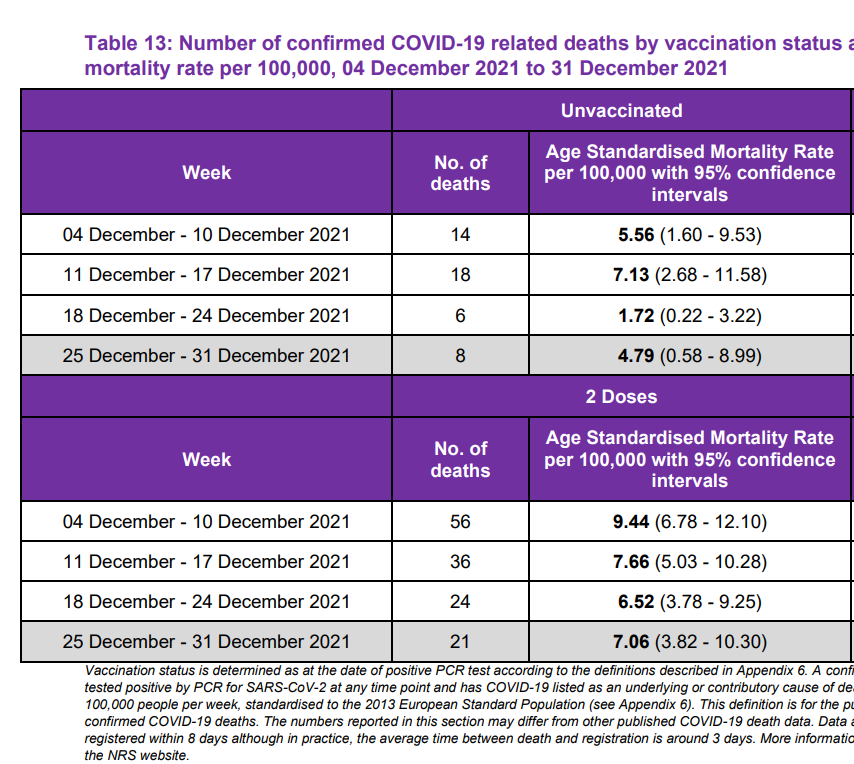
However this could be age confounded, so the Table below is much tougher to explain.
Here is the original reference.
The date of the report is in European format (Jan 12, 2022).
Table 13 is age standardized mortality rate. You can compare the numbers by week for unvaccinated vs. 2 doses. In every week, those who were unvaccinated did better. This should never happen if the vaccine really worked as advertised. How can they explain that? For dose 1 and dose 3, it does show a benefit, but the key question is why not for dose 2?
Note: This is COVID-related deaths. This doesn’t even consider COVID vaccine related deaths.
Source – https://stevekirsch.substack.com/p/think-vaccines-work?utm_source=url