
Researchers with the World Health Organization explain mistakes in high-profile mortality estimates for Germany and Sweden.
Scientists working with the World Health Organization (WHO) have corrected some surprising errors in its estimates of how many deaths the pandemic has caused, after a flurry of questions about the original WHO report, issued in early May.
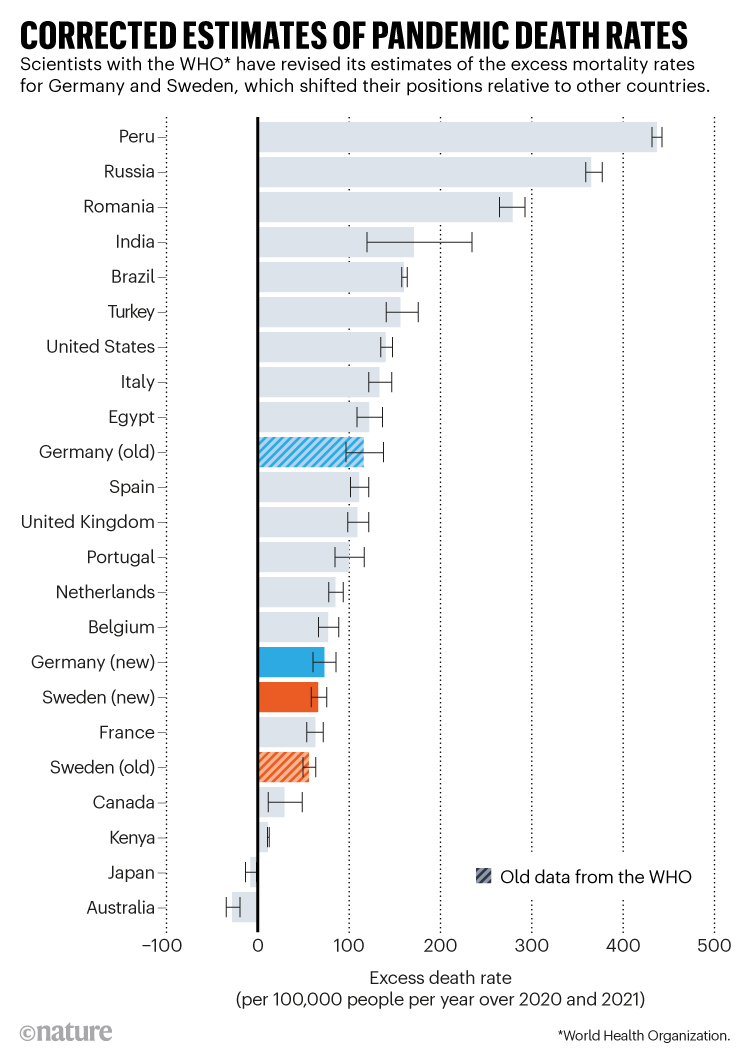
In a revision to a technical paper on their methods, researchers cut Germany’s pandemic-related deaths estimate by 37%, pulling its excess death rate below those of the United Kingdom and Spain1. They also raised their estimate for Sweden by 19% (see ‘Corrected estimates of pandemic death rates’).
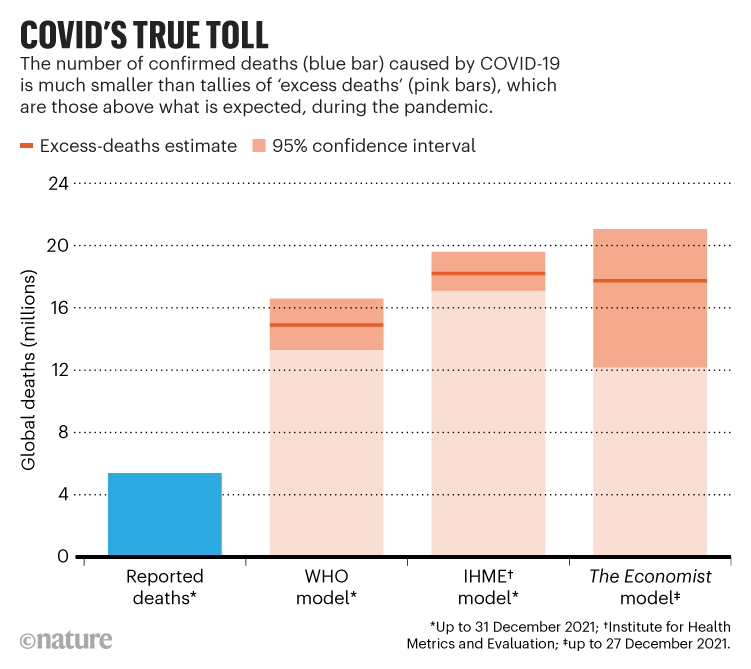
The WHO study released on 5 May had estimated excess death rates — meaning the increase in mortality above expected levels — for 194 countries. The organization reported that between 13.3 million and 16.6 million people had died worldwide from January 2020 to December 2021 because of the pandemic, more than 2.5 times the number of reported COVID-19 deaths. The estimate was more conservative than other analyses of excess deaths (see ‘COVID’s true toll’).
But some observers soon expressed concerns about the numbers for certain countries, particularly Germany. It was thought to have coped with COVID-19 better than many other countries in Europe, but the WHO estimated its excess death rate as higher than many of its neighbours.
“Almost straight away, we realized there was a problem,” says Jon Wakefield, a statistician at the University of Washington in Seattle who leads the WHO’s COVID-19 global deaths project and publicly tweeted the revised paper on 18 May. He says that the team is now in the process of re-examining all of its estimates.

15 million people have died in the pandemic, WHO says
The WHO project is a live model, which researchers said was always going to be updated as demographers gained more information. The organization has not yet changed the numbers on its project website (see go.nature.com/3azupk5). Official systematic updates of estimates for excess mortality — including for Germany and Sweden — will follow “in the next iteration planned later this year”, says Somnath Chatterji, a senior adviser in the WHO’s Division of Data, Analytics and Delivery for Impact in Geneva, Switzerland.
The mistakes matter because the WHO’s study swiftly received worldwide media attention as an official estimate of the true number of lives lost as a result of the pandemic. The project is also politically sensitive: some critics used the first set of incorrect estimates to challenge Germany’s pandemic policy. And India’s government disputes the WHO’s estimate of 3.3 million to 6.5 million deaths in the country, which is some 10 times greater than India’s official COVID-19 death toll. (Other researchers say the WHO’s estimate is more trustworthy than the Indian government’s; the WHO figure is also in line with several other studies.)
In an interview with Nature, Wakefield explained the problems his team found in their work. “We want to get this out there because it’s wrong. We need to correct it,” he says.
The big picture
To work out how many people died because of the pandemic, researchers model all deaths over the period and subtract a baseline of expected deaths (those that would have occurred in the absence of a pandemic). What remains is deaths above the norm: a more reliable measure of pandemic-related mortality than official figures provide, because many countries have under-reported or missed COVID deaths.
This kind of project can give only rough approximations, because it requires complex modelling and regular revision as new data come in. For instance, only 100 of the world’s countries have so far reported national deaths data each month for at least part of the pandemic period, the WHO says. Still, the WHO figures showed that some countries, such as India, Russia and Egypt, had massively undercounted their COVID-19 deaths: these countries’ excess deaths during 2020–21 were much higher than their official COVID-19 tolls. The estimates also showed the countries that had many more deaths than normal levels — several of them in South America. Peru stands out, with a surge in deaths that nearly doubled its usual mortality for those two years.
What surprised critics, however, was some of the results for wealthy countries that do report timely deaths data, such as Germany and Sweden. The problem seemed to be with the way expected deaths had been modelled. Within hours of the WHO’s results being published, commentators on Twitter pointed out that the organization’s prediction of expected mortality in Germany in 2020–21 was surprisingly low, pushing up the excess death figures.
Where the WHO went wrong
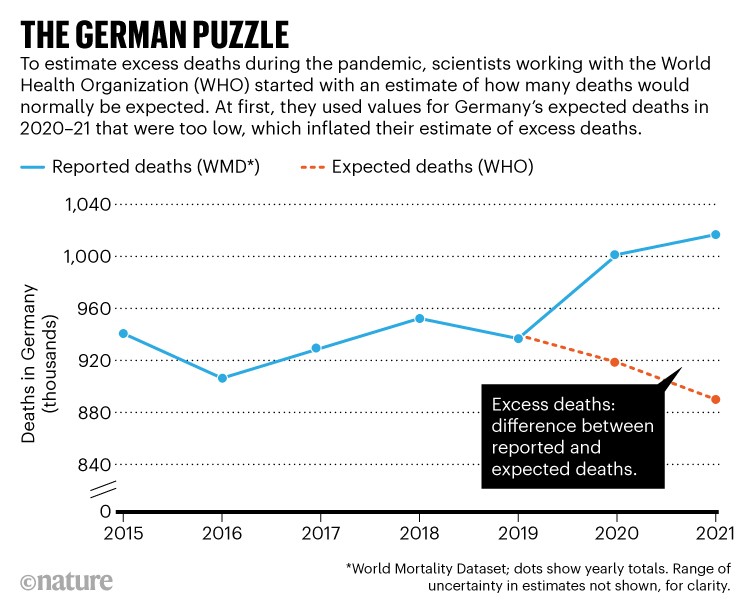
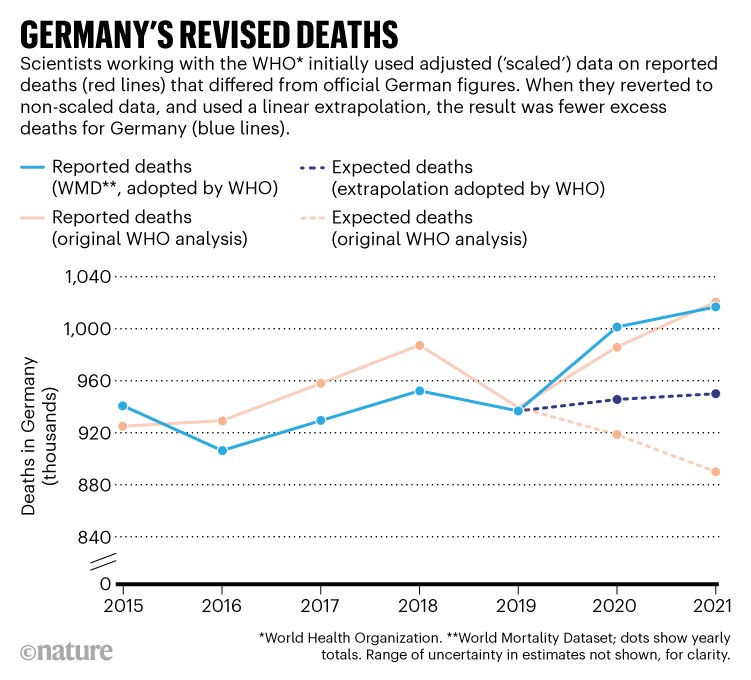
Researchers model expected mortality by extrapolating historical trends. For instance, the World Mortality Dataset (WMD), one widely cited project, uses a linear extrapolation from deaths in 2015–19 to account for underlying mortality trends. One researcher on that project, economist Ariel Karlinsky at the Hebrew University of Jerusalem in Israel, was also part of Wakefield’s technical team. However, the WHO group used a mathematical function called a thin-plate spline to estimate expected deaths for 2020–21. Unfortunately, commentators on Twitter noted, this function seemed to be too sensitive to a slight dip in Germany’s deaths in 2019; it predicted a decline in deaths in 2020 and 2021, as well (see ‘The German puzzle’).
“Extrapolating a spline is a known bad practice,” says Jonas Schöley, a demographer at the Max Planck Institute for Demographic Research in Rostock, Germany. Nature talked to other demographers, who agree.
Schöley was asked to look at the WHO’s technical paper back in April, and says he cautioned Wakefield then that spline extrapolations can lead to “erratic trend predictions”. But at that time, the data and estimates had been set in stone by the WHO team; Schöley was being consulted to check a different aspect of the work.
After the criticisms, Wakefield and the WHO team re-examined their extrapolation method. But they then discovered a second problem, which turned out to be a bigger concern: their data for actual deaths in Germany did not match the raw data from German statistical offices, also collated in projects such as the WMD. This mismatch affected not only deaths reported in 2020 and 2021, but also the 2015–19 historical data. That had played a major part in their low extrapolation of expected deaths.

The pandemic’s true health cost: how much of our lives has COVID stolen?
The mismatch occurred because WHO scientists had adjusted — or ‘scaled’ — the raw mortality data. The WHO often does this for data that it receives from countries, Wakefield says. That can be for good reason: the organization tries to adjust for under-reporting, inconsistencies with other data streams or ‘completeness’ errors — when mortality data from recent months are expected to rise as more results come in, for instance. But it was less obvious that this process should apply to Germany, a country with detailed mortality reporting. “We need to examine the way that adjusting for under-reporting is carried out,” says Wakefield.
Wakefield’s team reverted to the raw data and used a linear extrapolation into 2020 and 2021 (see ‘Germany’s revised deaths’). Ironically, the spline extrapolation on the raw data gives similar results, Wakefield adds. The overall effect cuts estimates of Germany’s excess deaths in 2020–21 from 195,000 to 122,000 (with a range between 101,000 and 143,000). Its excess death rate falls to 72.7 per 100,000 people per year, compared with 116 per year in the previous WHO report.
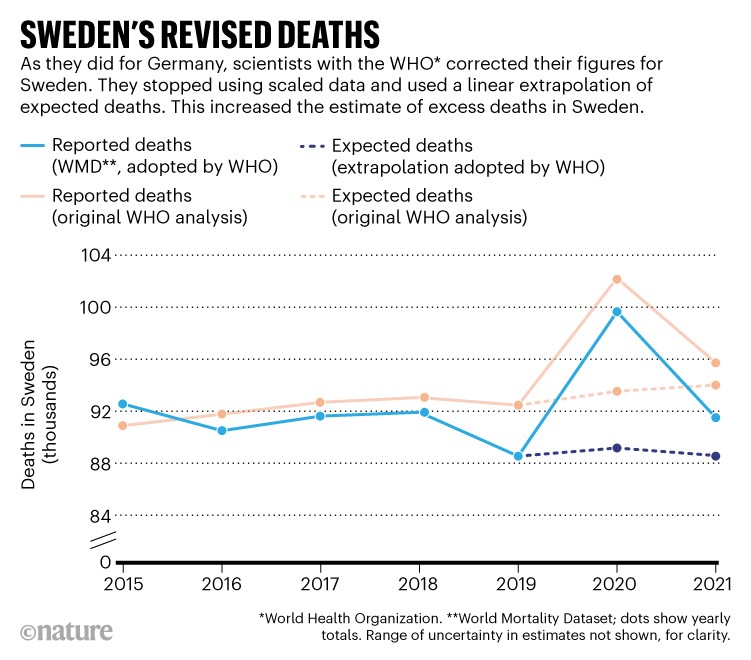
The researchers also corrected WHO numbers for Sweden, following similar criticism. One group that weighed in was the COVID-19 Actuaries Response Group — a forum of mostly UK-based actuaries who have regularly examined the pandemic’s impact on mortality. On 16 May, the group posted a blog noting that Sweden’s death figures in the WHO report didn’t match those from Statistics Sweden (go.nature.com/3nctx5s). In fact, the WHO figures seemed to differ from official reporting sources for many European countries.
It turned out to be the same two issues: the spline technique and scaling. Again, Wakefield’s team revised its approach to use the linear extrapolation on raw data (see ‘Sweden’s revised deaths’). In this case, Sweden’s annual excess death rate went up from 55.8 to 66.1 per 100,000. Schöley credits Wakefield with rapidly addressing the issue. “A role model on how to deal with honest public peer review,” Schöley tweeted.
Other European countries could yet also be affected by the WHO’s scaling of death figures — Norway is another that critics have raised queries over. Wakefield says his team will now revisit the WHO’s scaling procedures, as well as the way it extrapolates from historical data. “I don’t think it makes a big difference for most countries,” he says.
The revisions take the WHO figures for Germany much closer to those of another model, produced by The Economist. But a third model, from the Institute for Health Metrics and Evaluation (IHME) in Seattle, Washington, published in The Lancet, is now an outlier2. It estimates more than 200,000 excess deaths for Germany. “The Economist method is the more transparent and defensible,” Wakefield’s team wrote in its technical paper.
Asked for comment, Haidong Wang, a demographer and population-health specialist at the IHME, replied only that differences in the overall estimates can arise from how models treat mortality data, including how figures are adjusted for under-registration and completeness issues, and how models estimate expected mortality.
How to compare countries
As soon as the WHO results came out, researchers, politicians, journalists and others used them to compare countries. Some saw them as a way to evaluate nations’ policy responses to the pandemic.
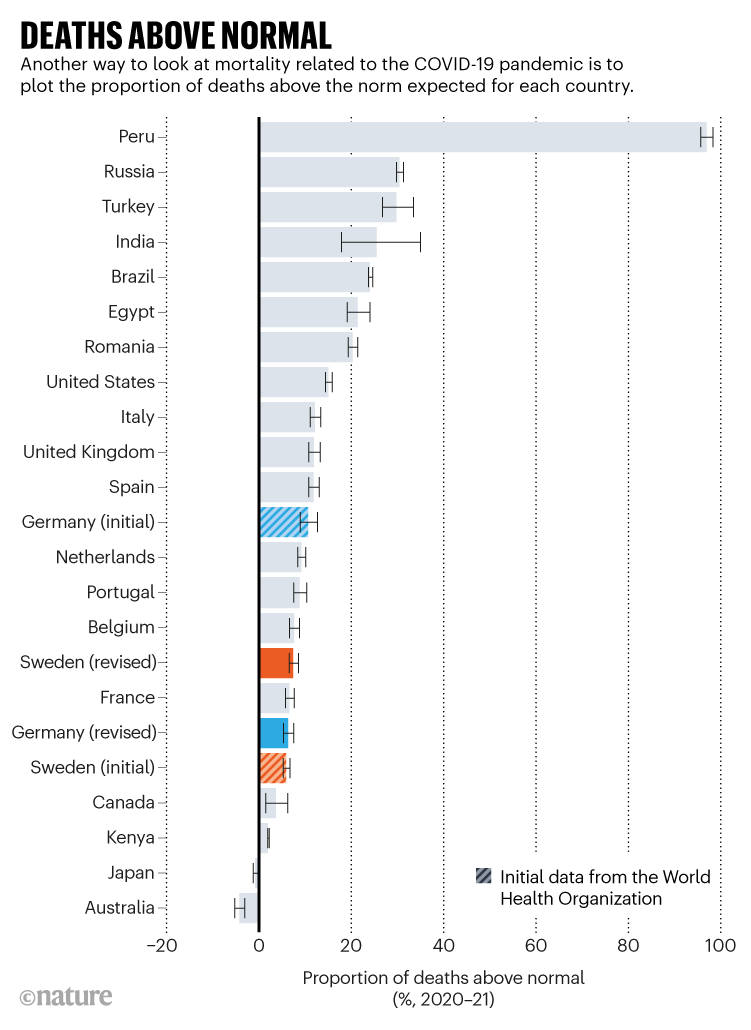
One subtlety with this is that excess death rates are not the only useful metric. Another is the proportion of deaths above the norm in a country, which can give slightly different results. For instance, Germany’s deaths in the pandemic were 6.5% above normal, while in Sweden, they were 7.5% higher (even though Germany’s per-capita excess death rate is higher than Sweden’s; see ‘Deaths above normal’). These figures come with a range of uncertainty — or ‘credible intervals’, as researchers refer to them. Still, even when two countries’ credible intervals overlap, the country with the higher central estimate does have a greater probability of truly having a higher excess death rate, says Wakefield.
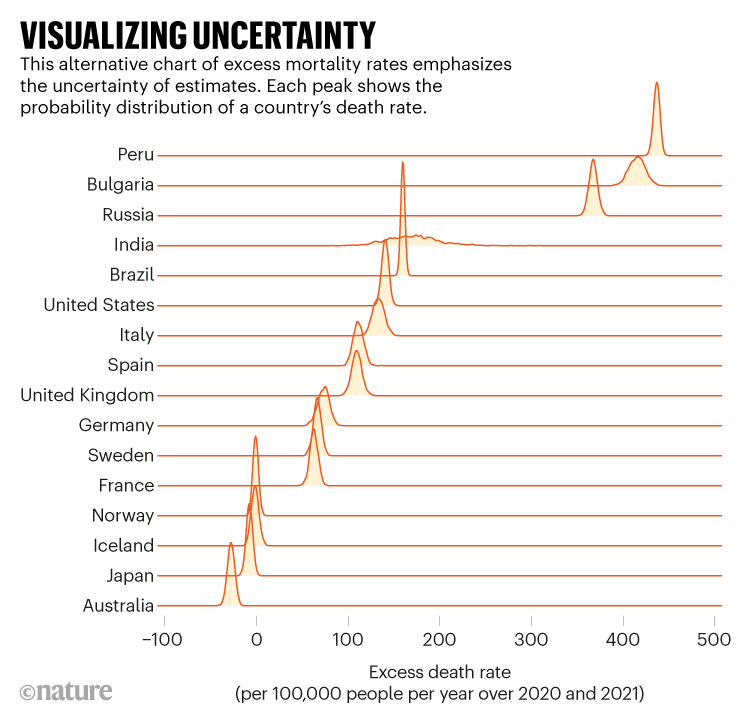
Demographers are experimenting with other ways of showing these ranges (see ‘Visualizing uncertainty’). This chart, which reports excess death rates including the revised German and Swedish figures, was generated by Victoria Knutson, a PhD student at the University of Washington who co-authored the revised technical paper on the WHO study methods.
A bigger problem with comparisons is that, although the death-rate figures do show how badly nations were hit by the pandemic relative to each other, this is in part a reflection of demographic differences between them. If one wants to estimate the relative success of a country’s pandemic mitigation strategy, says Schöley, it’s crucial to use figures that are adjusted for the particular demographics of that country, because COVID-19 mortality risk is higher for older people and for men. Wakefield says this adjustment would give a more nuanced picture, but that the WHO didn’t release global age-adjusted excess death rates because reliable age-specific mortality estimates are not available in many places.
Some organizations are reporting provisional data using age-standardized mortality rates. For instance, the UK Office for National Statistics does so in its comparisons for all-cause mortality across Europe, although it has not yet included data to the end of 2021.
Other researchers, including Schöley, have taken a related approach, reporting in preprints3,4how average life expectancy — which is calculated using age-specific mortality rates — has changed over the pandemic in more than 20 countries. On the basis of these calculations, for instance, the United Kingdom has fared worse than Spain and Italy in terms of life expectancy lost over the past two years, even though the three countries have broadly similar excess-death numbers. Spain, Italy and Germany have roughly equal values for life expectancy, and Sweden and other Scandinavian nations had by the end of 2021 recovered the average life-expectancy losses caused by the pandemic (see ‘Life-expectancy losses’).
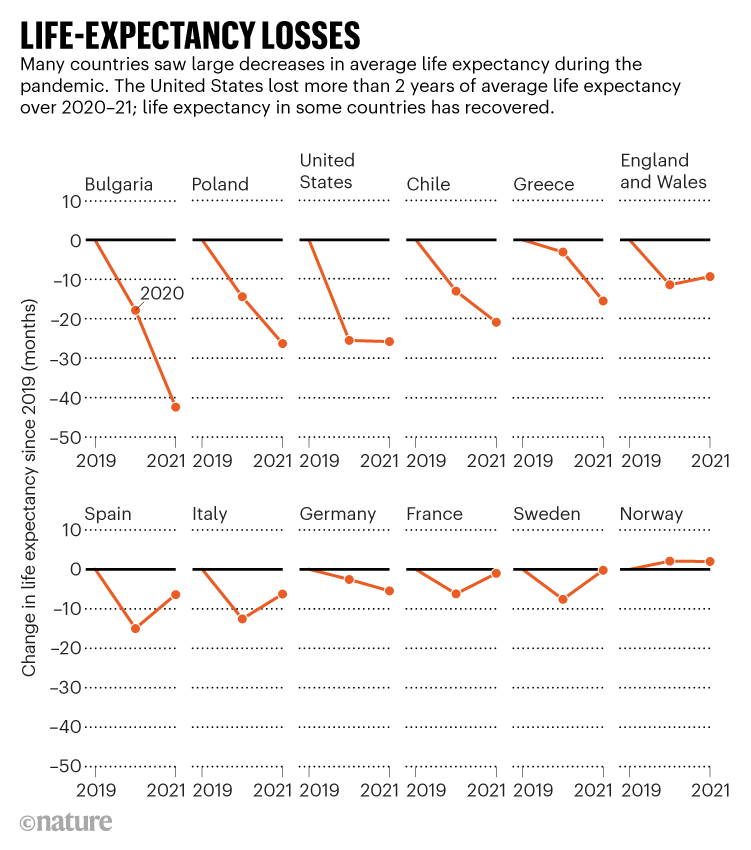
The figures also show that the United States has performed worse than many comparably rich nations — having lost more than two years of average life expectancy compared with 2019.
Life-expectancy calculations, however, tend to give more weight to premature deaths in younger people — because more years of life are lost in such cases. The United States also saw a notable excess of deaths in younger age groups, demographers say.
Reflecting on the corrections, Wakefield concedes that the errors were unfortunate. “Look, we got it wrong,” he says. “And I don’t have a problem with that, to be honest. Because that’s science, right? If someone criticizes you, let’s just correct it. It doesn’t mean everything’s wrong. What I think it actually means is we’ve got a very transparent approach and that we are willing to take note of reasoned criticism.”
The pandemic’s true death toll: millions more than official counts
“I would hope that people realize that it is not possible to get every country right first time, and I definitely think our estimates are more reliable than those of IHME and The Economist,” he adds.
The biggest uncertainties in studies of excess deaths, he says, are not with data-rich European nations, but with countries that don’t publish any timely all-cause mortality data. For these countries, demographers must use computer models to estimate what mortality probably was, on the basis of other countries with similar characteristics, and on any surveys that give a hint of regional deaths.
That difficult procedure is what the WHO team spent most of its time on, Wakefield says. It is these results that are the most likely to change in subsequent updates if further data on mortality can be gathered, using measures such as surveys as well as official statistics. “If we could get some data for many countries in Africa, that would be a big change,” he says.
Nature 606, 242-244 (2022)
Source – https://www.nature.com/articles/d41586-022-01526-0?